It all started right before BIO…
I was looking for people to meet on the conference platform when a "Renal" tag caught my eye. With one click, I could see pharmas, biotechs, investors, patient associations and CROs with any interest in renal indications.
We had just nominated ADPKD (Autosomal Dominant Polycystic Kidney Disease) as our lead indication then, positioning it to spearhead our pipeline of RNA-upregulating small molecules. We did not take that decision lightly (oh, so not lightly!), but I knew I still had so much to learn about the disease and its therapeutic landscape. Mapping the programs in development seemed like a good place to start.
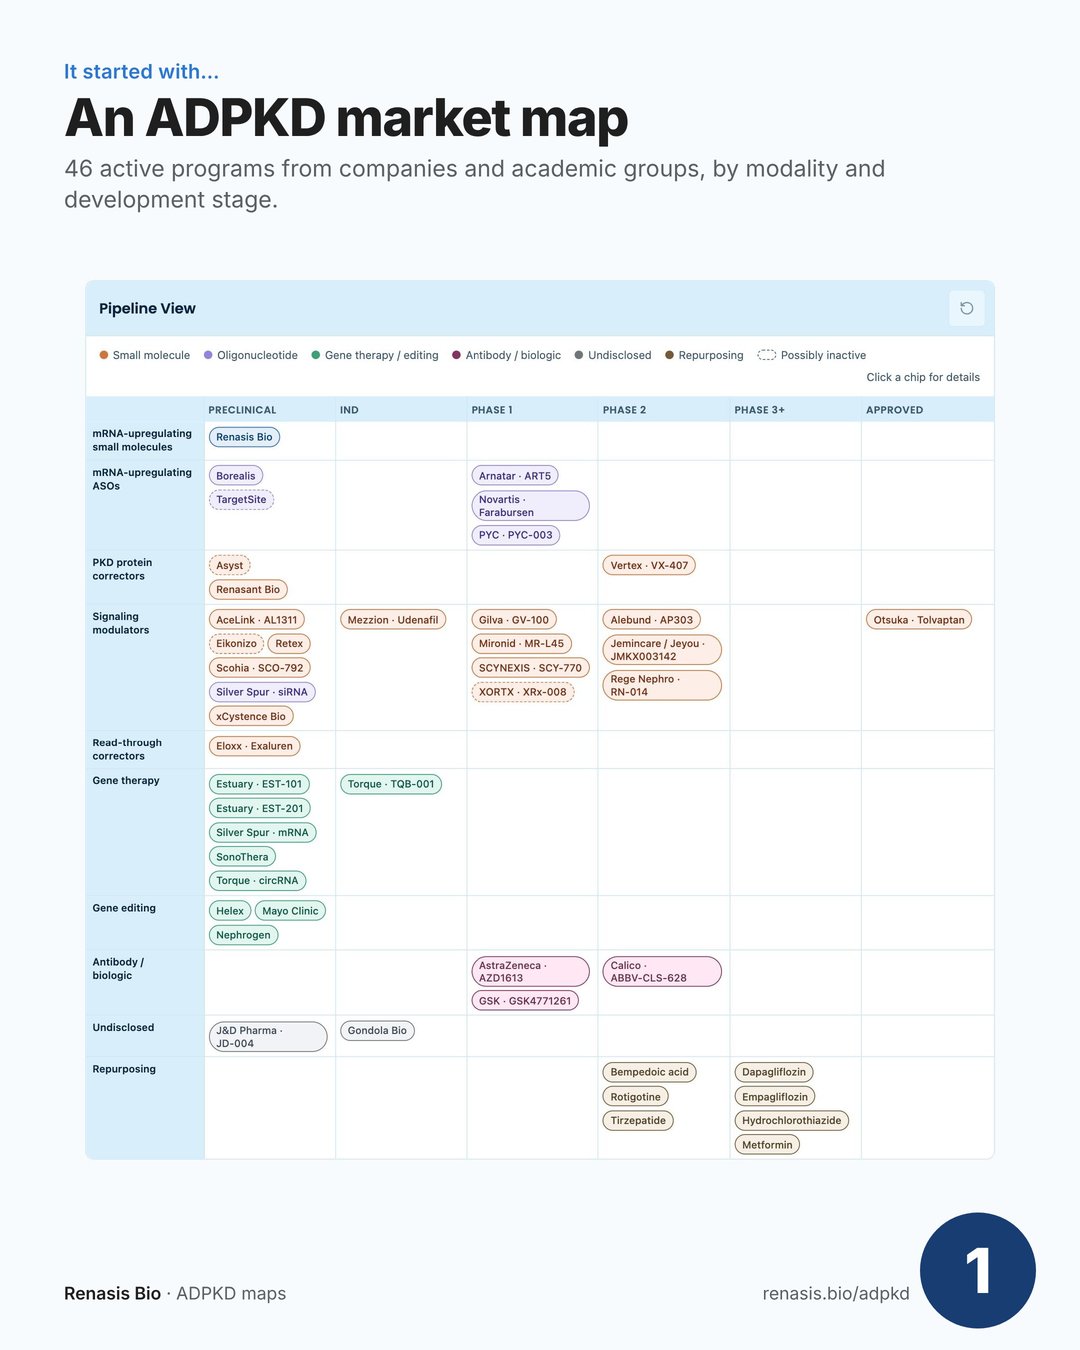
At the conference, people got excited when I mentioned the map I made, so I started sending it around. People started telling me about programs I'd missed. A random search led me to PKDCureTracker.com by Renato Molina Toth, which revealed many repurposing programs. And my weekly ADPKD alert kept surfacing news of even more programs.
A mental model started to form: Otsuka Pharmaceutical bringing first hope and validating the market; Vertex Pharmaceuticals, AbbVie / Calico Life Sciences and Novartis (acq. Regulus) bringing additional modalities to the clinic; researchers from around the globe spinning out their discoveries - xCystence Bio (AUS), Nephrogen (SF), Borealis Biosciences (CAN), Mezzion (KOR); and visionaries like Torque Bio, Estuary Biotherapeutics, Renasant Bio and many more who are pushing the boundaries of science to promote human health.
Then I got curious about discontinued programs: why were they stopped? what's been learned? how did the field evolve?
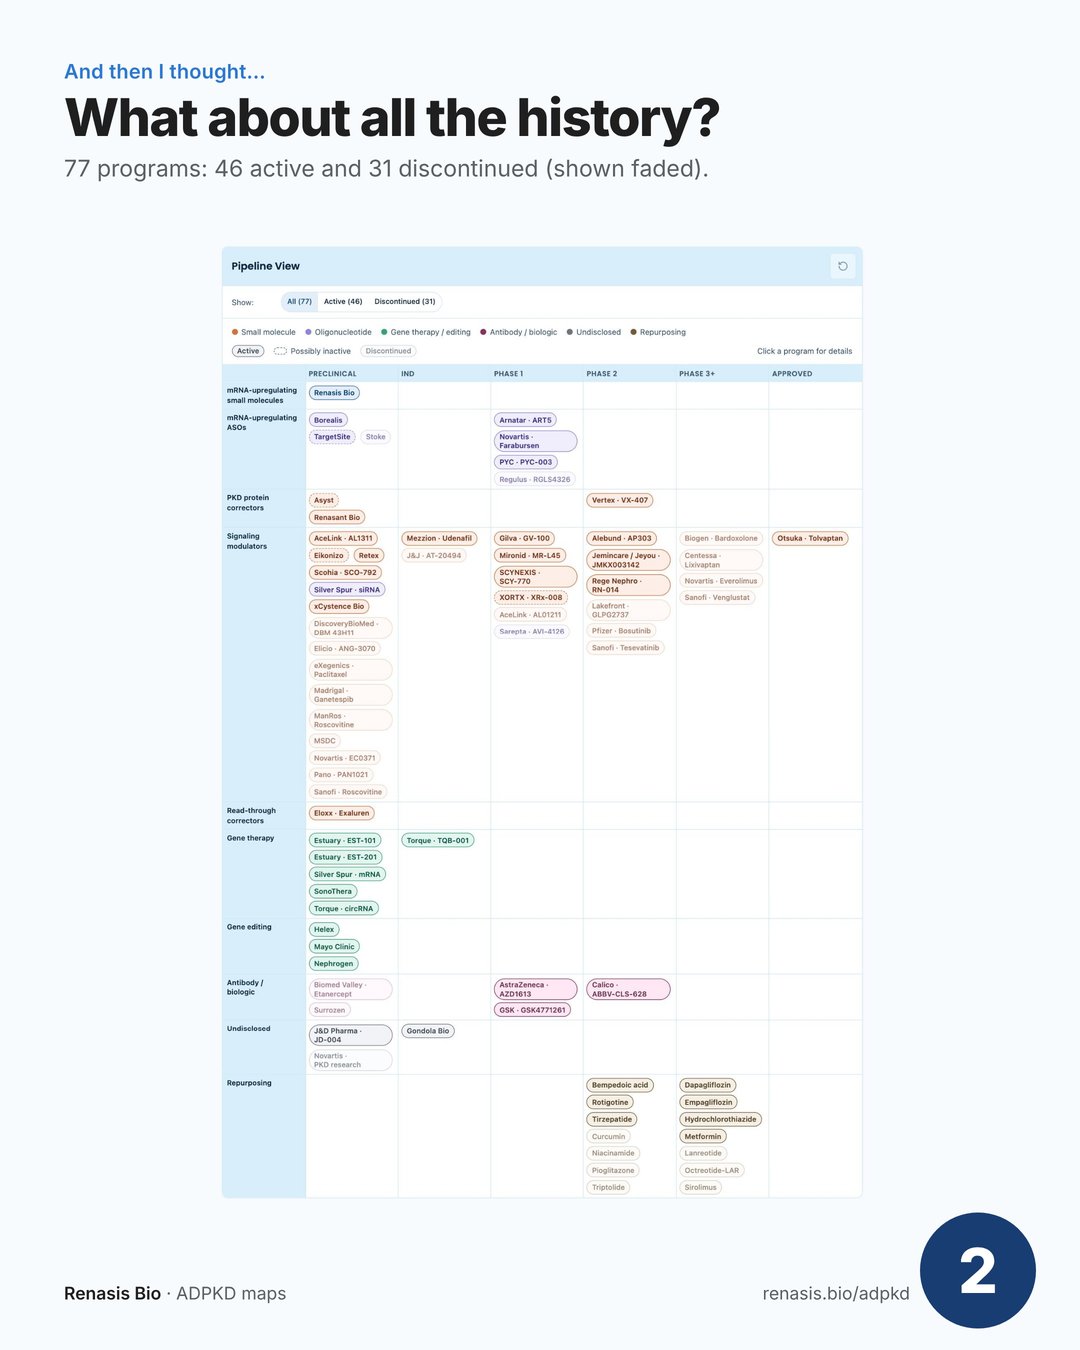
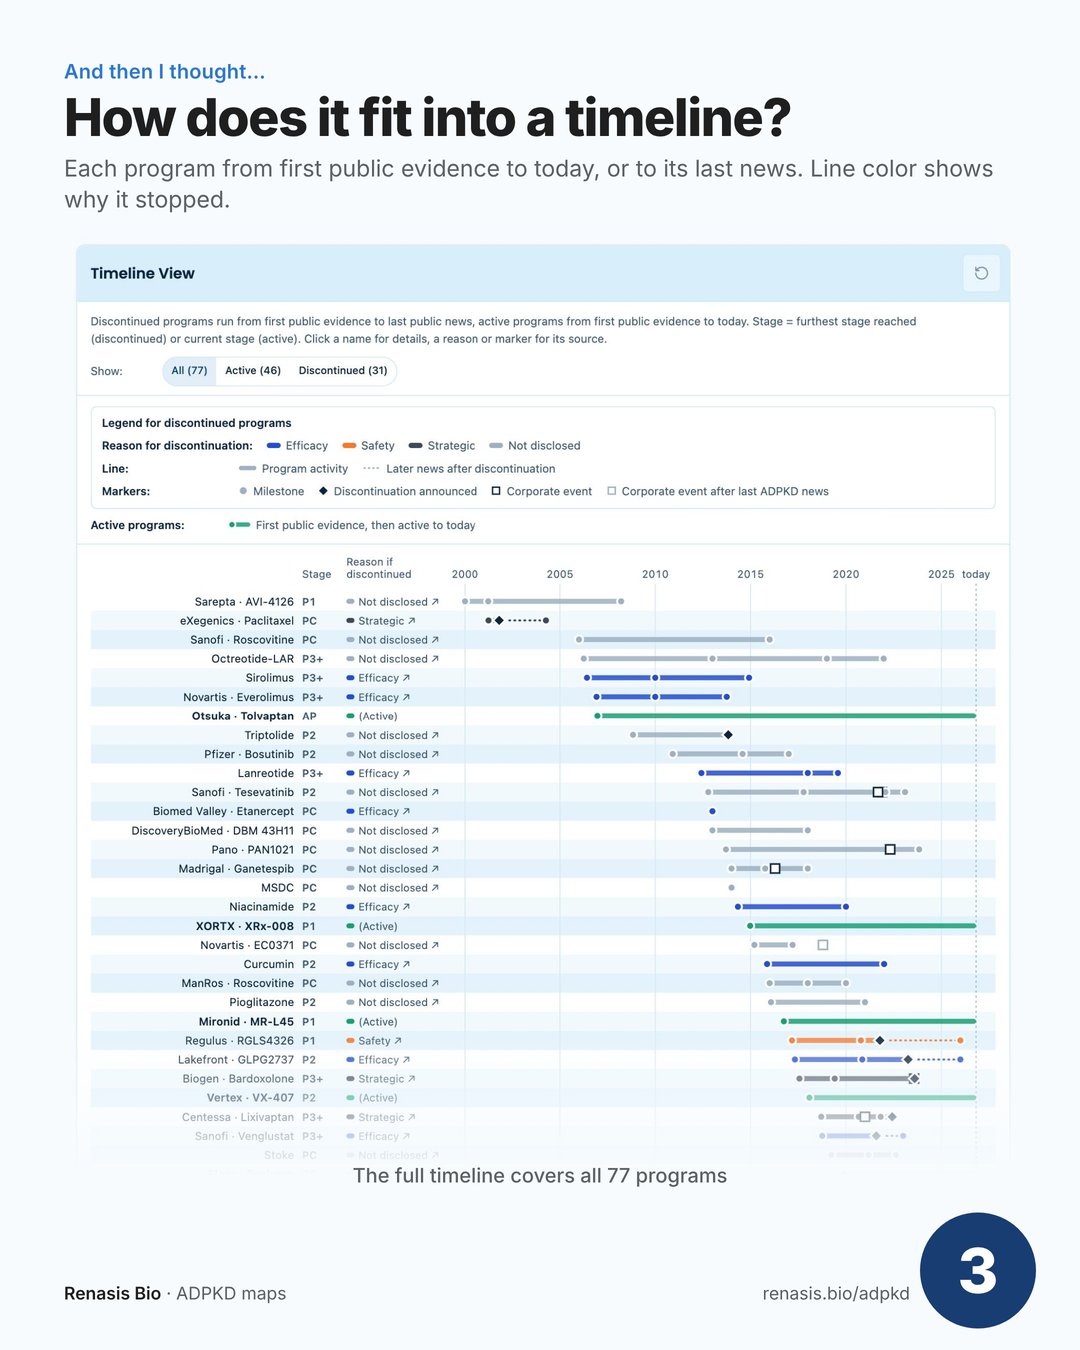
This became a little obsession, and here's what I learned:
- ⤵️ Many programs targeting indirect pathways were discontinued for lack of efficacy.
- 🏦 Some were neglected simply because their parent company was acquired for a lead program outside PKD.
- 📈 That latter pattern is fading. More companies now have ADPKD as their lead indication, and interest in the space is growing.
But on paper it was still one huge table, and that's not how I think. My brain visualizes networks and relationships. So I asked Claude to help me turn everything into a cell model. It took a few iterations, I'll tell you, but I love the result. It teaches me things the raw tables never showed me.
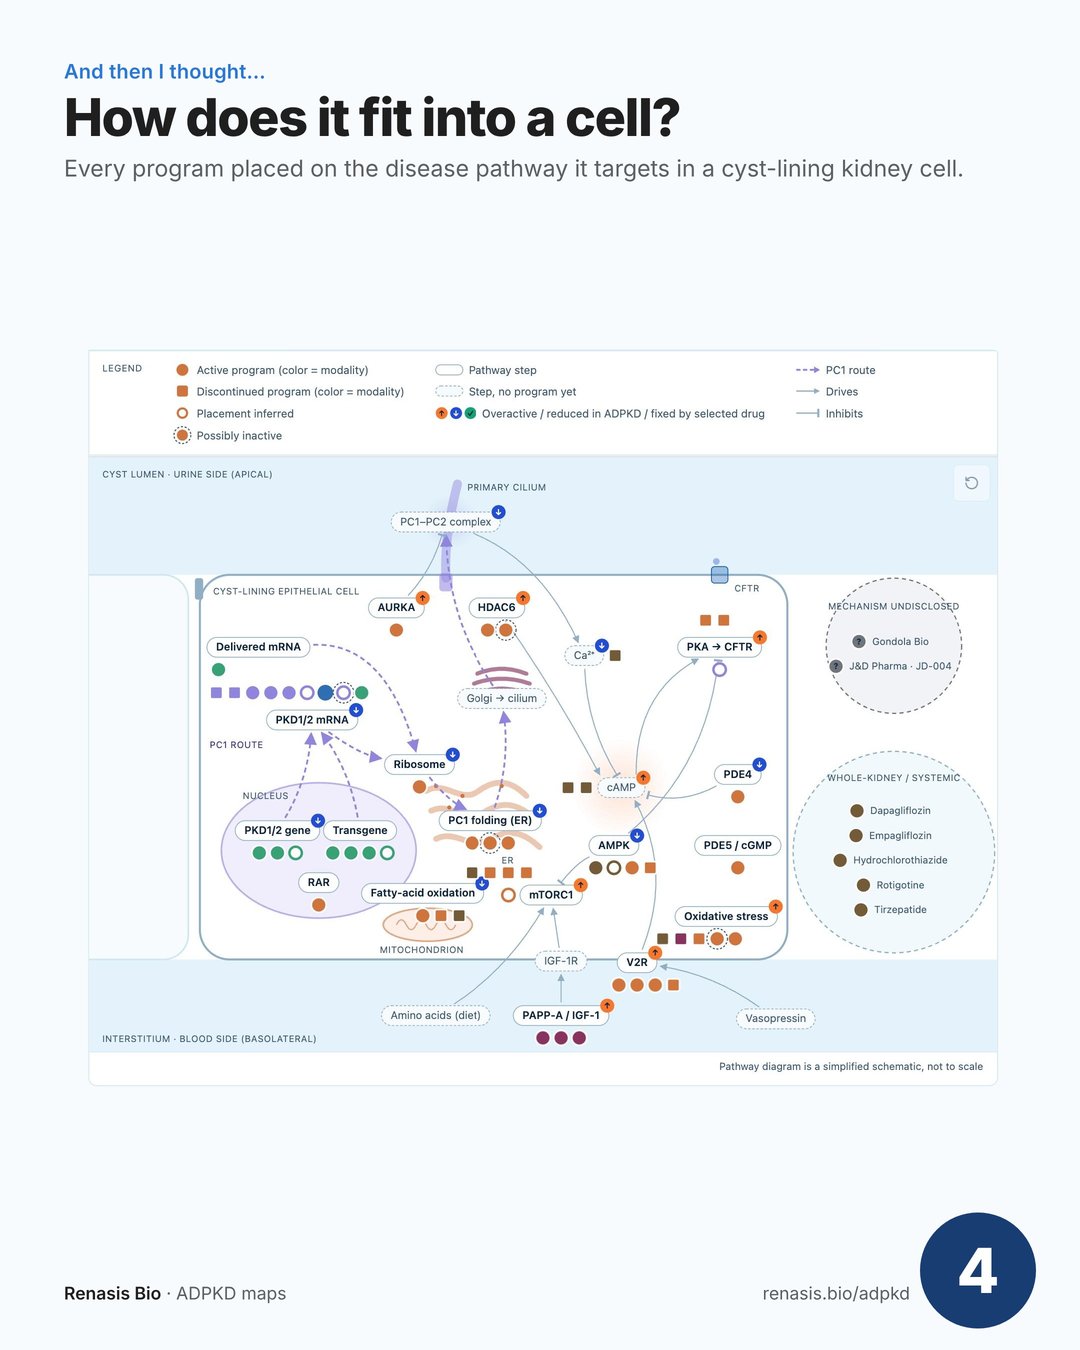
Since the work was already done (OK, Claude did most of it, but I told it what to do!), I thought it would be nice to share it with the community 🤗
Thank you to everyone working on this worthy cause. I hope we can help bring patients the cure they've waited far too long for ❤️
Sources
- Programs, active and discontinued: the Renasis Bio active programs map, history map and cell map, each program linked to its sources; as CSV: programs.csv, organizations.csv, program_owners.csv
- Repurposing programs: PKDCureTracker.com